/
Lab Result Graph Formatting in DVMAX
Lab Result Graph Formatting in DVMAX
- John Bellos (Unlicensed)
Owned by John Bellos (Unlicensed)
Because every printer is different, the way a lab graph displays in history can vary. This is why we have advanced settings to allow the user to modify the margins and format of the graph on their own.
To modify these settings, follow the steps below:
- Log into DVMax as the Administrator.
- Click on the Section menu, hold down SHIFT and click System Constants.
- A warning will appear, read it fully and click I Understand.
- On the list of advanced settings, scroll down until you get to settings that start with lab.
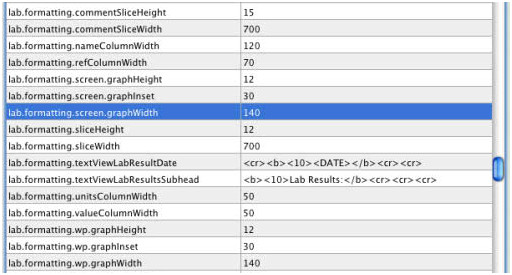
- The following picture gives some solid setting adjustments that will help your lab graph look better on printed history:
- If you find that some test names are still not fitting, you can try adjusting the lab.formatting.nameColumnWidth to be a slightly larger number, but going much larger will cause the graphed area to be pushed off the visible area.
, multiple selections available,
Related content
Understanding the Lab Log
Understanding the Lab Log
More like this
Generating a Net Value Report Using the Custom Print Option
Generating a Net Value Report Using the Custom Print Option
More like this
Configuring DVMAX with the Heska DCU (Data Capture Utility)
Configuring DVMAX with the Heska DCU (Data Capture Utility)
More like this
Weight Display Settings
Weight Display Settings
More like this
Lists in DVMAX do not appear correctly due to font sizing.
Lists in DVMAX do not appear correctly due to font sizing.
More like this
Generating an Inventory Work List Using the Custom Print Option
Generating an Inventory Work List Using the Custom Print Option
More like this